The market has increasingly begun to discriminate between AI CapEx-exposed companies that can translate investment into higher ROIC and those where rising capital intensity has yet to generate commensurate returns.
Ultimately, this brings the AI investment debate down to two critical questions:
- Will the growth in AI compute supply eventually outpace demand-a negative for returns-or will demand continue to exceed available supply, supporting pricing, utilisation and ROIC?
- And, importantly, how can we measure that balance?
One of the more interesting indicators I have recently come across for assessing the AI investment cycle and Supply-Demand usage dynamics is the emerging GPU rental forward curve. But let's get started with some insights about AI Supply-Demand.
Supply is expanding rapidly through unprecedented hyperscaler and neocloud capex, but demand appears to be arriving at least as quickly. Firm rental pricing, including for older GPU generations, suggests that additional capacity continues to be absorbed.
This is particularly important because some of the physical constraints cannot be solved simply by spending more money. Grid connections, permitting and data-centre construction can take years.
At the same time, falling inference/token prices are not necessarily evidence of weakening demand. The key variable is elasticity:
Compute economics ≈ Price × Volume
Suppose inference prices (e.g. token prices) decline 50%, but cheaper intelligence and agentic applications increase usage 5×:
0.5 × 5 = 2.5×
Aggregate inference activity would still be roughly 150% higher, despite prices having halved.
Agents could reinforce this effect because one human instruction may generate dozens or hundreds of model calls. The bearish scenario is therefore not cheaper AI per se, but cheaper AI without sufficiently higher usage.
1. Introducing the GPU Forward Curve
This is why I find the emerging GPU rental forward curve particularly interesting as an indicator of the AI investment cycle and whether Supply-Demand imbalances materialize.
Until recently, investors could observe current GPU rental prices but had limited market-based information about how compute scarcity was being priced several months or years into the future.
There are three useful concepts:
-
Spot rate: the market-clearing rental price of GPU compute today.
-
Term rate: what users are willing to pay today to secure GPU capacity for a defined period.
-
Forward rate: the future rental rate implied by today's term structure.
Importantly, the forward rate is not simply someone's forecast. It is derived from observed term rates using the same broad no-arbitrage logic used across rates and commodity markets.
This creates something AI compute has historically lacked: a market-implied term structure of future compute pricing.
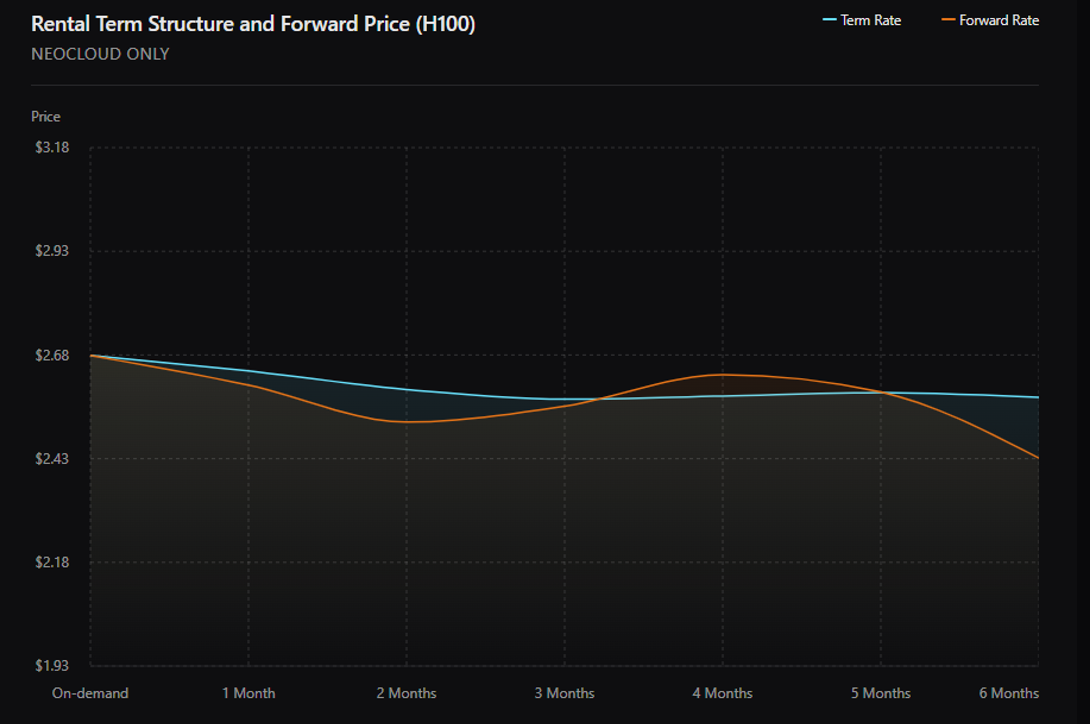
source: https://www.silicondata.com/products/forward-curve
2. Forward Curve Implications
The most interesting information may not be the absolute GPU rental rate, but the shape and evolution of the curve, which can provide an interesting framework for assessing the AI capex cycle:
- Contango - forward rates > spot: Consistent with the market expecting demand growth and/or persistent future supply constraints.
- Backwardation - forward rates < spot: Consistent with expected supply expansion - new GPU generations, hyperscaler capacity or data centres coming online - and/or weaker demand.
- Humped curve: Consistent with acute scarcity over a particular horizon that the market expects subsequently to resolve.
Suppose hyperscalers announce another $100bn of AI infrastructure investment:
- AI capex ↑ + GPU forwards ↓: Supply may finally be catching demand with increasing risk of future excess capacity.
- AI capex ↑ + GPU forwards stable: New capacity continues to be absorbed while demand remains exceptionally strong relative to deployable supply.
We can extend the same framework to inference pricing:
Token prices ↓ + GPU forwards stable: Strong demand elasticity. Lower AI prices are stimulating enough additional usage to maintain compute scarcity.
Token prices ↓ + GPU forwards ↓ materially: Potential evidence of weaker demand elasticity and a more concerning signal for AI infrastructure economics.
This distinction also matters for hyperscaler profitability. Much of today's capacity was contracted before the full strength of AI demand became apparent. If utilisation continues increasing while compute remains scarce, contracts rolling onto higher market rates could create substantial operating leverage.
In other words:
Capex → Capacity → Utilisation → Pricing → Cash flow
The investment comes first. The full economics of that investment may only become visible later.
3. Conclusions
GPU forward rates could become a useful additional indicator for distinguishing between two very different interpretations of the current AI infrastructure boom:
an overinvestment cycle creating future excess capacity
versus
an infrastructure build-out that is still struggling to satisfy underlying demand.
Different indicators tell us different parts of that story:
- Semiconductor revenues → what has already been sold.
- Hyperscaler capex → what companies intend to build.
- GPU spot rates → compute scarcity today.
- GPU forward rates → how the market is pricing future compute scarcity.
That final piece is potentially very valuable.
If hundreds of billions of dollars continue flowing into AI infrastructure while GPU forward pricing remains firm, it would suggest that supply is increasing enormously, but demand is still absorbing it.
Conversely, falling forward rates alongside accelerating capacity additions could provide an early indication that the physical AI bottleneck is finally beginning to ease.
For investors, the level, slope and evolution of the GPU forward curve could therefore become an interesting real-time indicator of where we are in the AI capex cycle.
------------------------------
Carlos Salas
Portfolio Manager & Freelance Investment Research Consultant
------------------------------